Projects
Global Change Impacts on Amazonian Biodiversity
As part of our objective to provide rapid assessments of ecological disasters and forecast their impacts, we have assessed the catastrophic and widespread fires in the Amazon in 2019. We assessed how fire losses and the species they impact have changed over the past two decades based on high resolution remote sensing data.
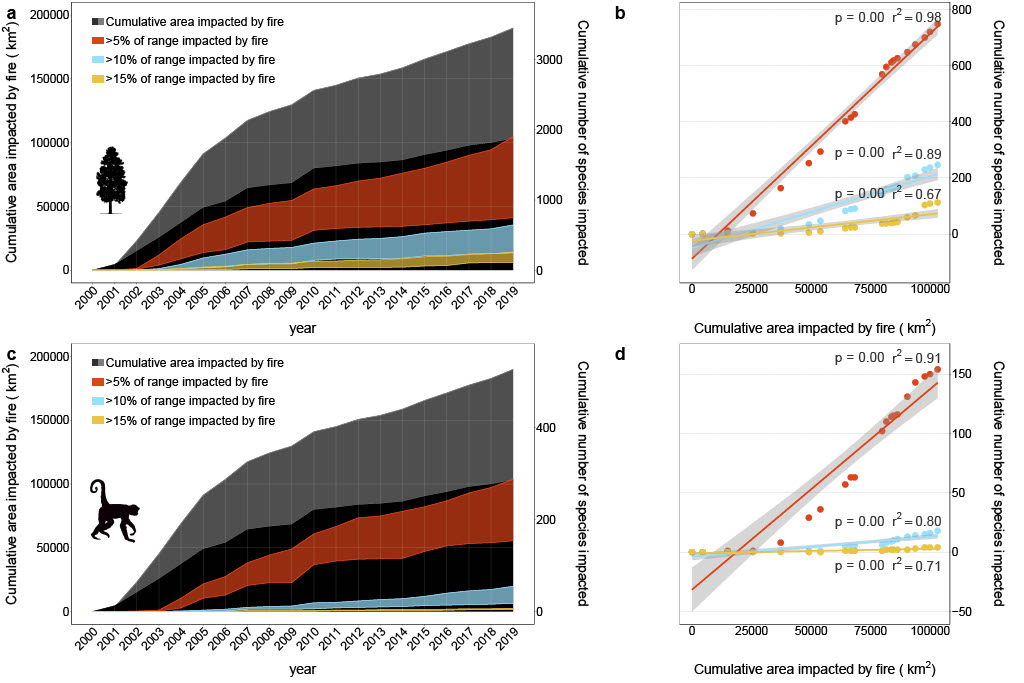 Left: Cumulative effects of fire on biodiversity in the Amazon rainforest. Curves depict cumulative numbers of plant (A) and vertebrate (C) species impacted by fire since 2001 (hollow symbols represent the results based on simulated fire data). Solid lines indicate total impact across the Amazon Basin, while dotted lines represent the impact confined to Brazil. Correlations between the cumulative area impacted by fire and cumulative number of plant (B) and vertebrate (D) species in the entire forest are depicted with a 95% confidence interval (p values < 0.001). Silhouettes are courtesy of LeonardoG (photography) and T. Michael Keesey (vectorization) under a CC BY-SA 3.0 license (https://creativecommons.org/licenses/by-sa/3.0/).
Cascading Hazards in Australia
We studied the impacts of drought and fire on all plant species in Australia during the record breaking 2019-20 fires. This work is ongoing but is notable because we have leveraged a collaboration with the lead of the Australian assessment team, Rachael Gallagher, to use our work to guide prioritization of management and monitoring and recovery efforts post-fire. This has resulted in a ‘white paper’ report to the Australian government and will guide funding initiatives to advance monitoring of high-risk species.
To better understand how a series of ‘cascading environmental hazards’ may work in concert to alter vegetation dynamics in Australia, we are working on two projects that will help to understand and then forecast vegetation dynamics post fire. In the first, we are examining how post-fire biomass recovery is influenced by post-fire floods that drain systems of the resources needed for recovery. In the second, we are examining what factors drive variation in fire severity (2019-20 was noted for particularly devastating high severity fires) so that we can forecast the return times of extreme years such as 2019-20.
Understanding Emerging Hazards
Given the crucial role the rise of COVID-19 has played in our lives over the past year, we chose to shift some of our modeling resources to understanding COVID spread globally. The same spatial modeling and machine learning skills, along with fluency in remote sensing products and disease spread that enable us to do ecological forecasting are also well suited for studying COVID spread. Our team has produced three manuscripts exploring global patterns of COVID spread early in the pandemic. The first paper was the first to detect a signal of the negative effects of UV on spread rate, while cautioning that this effect was insufficient to protect against irresponsible human behavior during summer (predictions made in April 2019, which were unfortunately correct). A second paper quantified the role of intervention on COVID spread by using remotely sensed N2 emissions to quantify socioeconomic activity (or lack thereof) as a proxy for widespread intervention. A third paper looks at whether virus evolution has contributed significantly to differences in spread in different countries/states across the world. In particular, we have found evidence that spike protein structure from two of the five accepted clades considered has correlated well with higher growth rates.
Quantification of future drought risk at global scale
The significance of the impacts of droughts to ecosystems and the fact that climate change is expected to lead to more frequent and more severe droughts, necessitates the development of approaches to derive robust estimates of future changes in drought risk and their associated impacts. We have developed a new methodological framework for estimating drought risk at global scale. The framework is based on the combination of a novel statistical framework for the analysis of extremes with state-of-the-art climate data and projections. This framework allows us to evaluate at global scale how e.g. drought severity is expected to change or what will be the anticipated spatial extent of future droughts. Such information combined with predictive models for a) drought-related hazards such as fires, b) species distribution models or c) vegetation recovery models, can provide critical information for developing effective mitigation procedures.
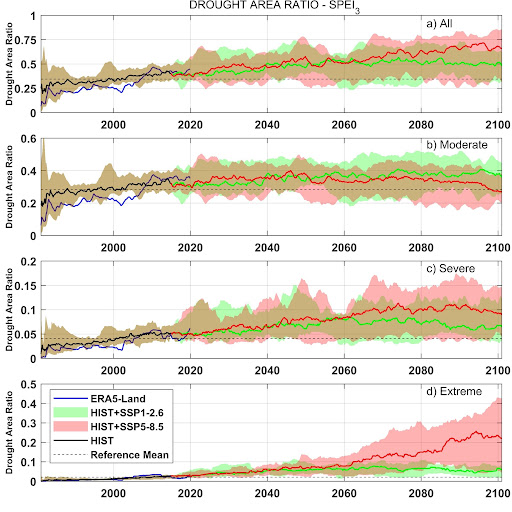 Left: Projections of area under drought conditions in Australia. Multi-model projections for different emission scenarios and drought severity classes. Source: Araujo et al. “Today’s 100-year droughts in Australia may become the norm by the end of the century.” Environmental Research Letters (under revision).
Global Forest Structure
Forests sequester approximately 30% of annual carbon emissions to the atmosphere, but increasingly lose carbon back to the atmosphere through deforestation and degradation. Forests are a key component of climate change mitigation strategies through the UNFCCC, with large scale forest conservation, reforestation and afforestation included in many national commitments to combat climate change. To date, we have not had an accurate global forest carbon product, largely due to a lack of appropriate satellite data relevant to mapping forests in 3D. NASA’s GEDI mission (launched 2018) has released global-scale forest height, canopy cover and biomass products, enabling the quantification of carbon impacts of forest conservation activities. GEDI data also provide insights into the linkages between forest structure, carbon dynamics, and environmental change (e.g. shifting climate regimes).
This sub-group focuses on using GEDI data to map forest structure at a range of spatial scales, and explore questions related to quantifying forest carbon stocks and fluxes associated with environmental change and forest conservation. GEDI data have enabled the team to map global-scale impacts of global forest conservation activities, such as the avoided carbon emissions associated with protected areas. These results highlight the importance of forest protection for achieving climate targets, particularly for countries with high deforestation rates. GEDI data are also linked to the team’s work in Colorado, California and the Amazon, quantifying the relationships between forest structure and drought. Understanding how climate impacts forest structure and carbon enables the forecasting of ecosystem carbon dynamics in future climate scenarios.
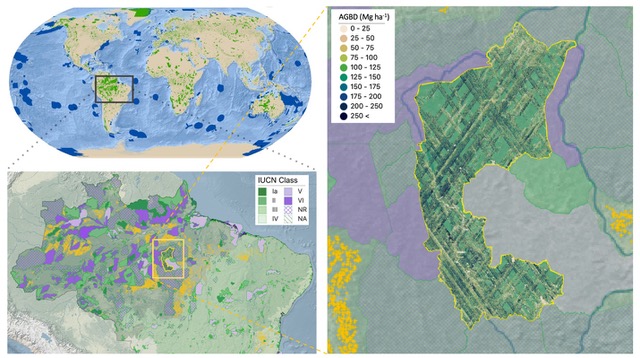 Left: Global protected areas are statistically matched to ecologically similar areas, and GEDI data are used to quantify the avoided carbon emissions associated with protected areas.
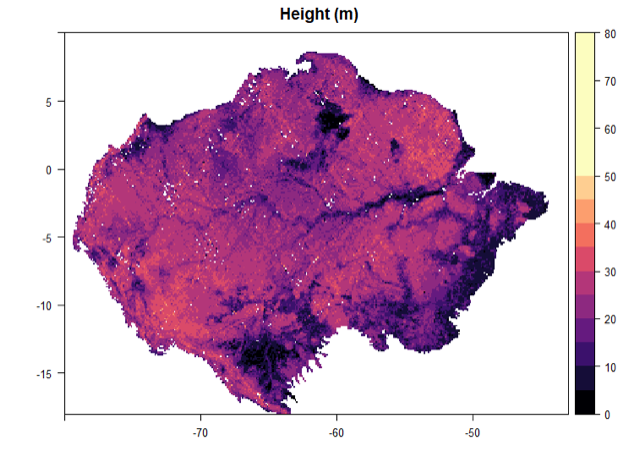 Left: GEDI data are used to map forest height and biomass both for the Amazon basin, and at a global scale. These forest structure maps are linked to environmental change such as drought products, which will help understand and forecast potential future changes in forest structure and biomass associated with shifting climate trends.
Colorado Climate Change
Mountainous watersheds provide 60-90% of water resources worldwide, and have accordingly been referred to as the ‘water towers’ of the world. However, uncertainty associated with predicting watershed hydrobiogeochemical behavior remains high as climate change, extreme weather, wildfire, land-use change, and other disturbances significantly reshape interactions within the world’s watersheds. Recent global-climate-model ensembles predict increased temperature and earlier snowmelt in western North America and reduced spring precipitation and increased late summer monsoon precipitation in the future.
Recent works of this subgroup have focused on understanding and characterizing the heterogeneity (hydrology, geomorphology, and ecological properties) governing mountainous watersheds. We investigated bedrock-through-canopy properties by integrating different sensing technology and identifying environmental factors driving plant communities distributions and dynamics as well as biogeochemical processes.
This subgroup is currently focusing on understanding variation in the flux of water in a headwater catchment of the Colorado River. Such catchments are important for water resources, because they influence hydrology through evapotranspiration (ET) and nutrient cycling. Using data from satellites, airplanes and on-the ground long-term surveys we are harnessing remote sensing data to have a detailed picture of how shifts in biodiversity have impacted watershed function. We have focused on understanding how changing patterns of temperature and drought are driving shifts in composition, diversity and functional trait distributions of the vegetation, and how these climate and vegetation changes have in turn resulted in changes in ET and ecosystem productivity.
 Left: Watershed ecosystem characterization and impact of landscape properties on plant community distribution: a) Map of plant species/communities distribution at 1m scale across the 4 watersheds derived by airborne hyperspectral imagery; b) Insect map showing a portion of an Aspen forest with associated canopy height (CHM) derived by airborne LiDAR data; c) PCA biplot showing the co-varibiality between community distribution and abiotic properties. (Falco et al, in prep).